-
Statistical analysis report
- Client:
- Date:
- Skills:
-
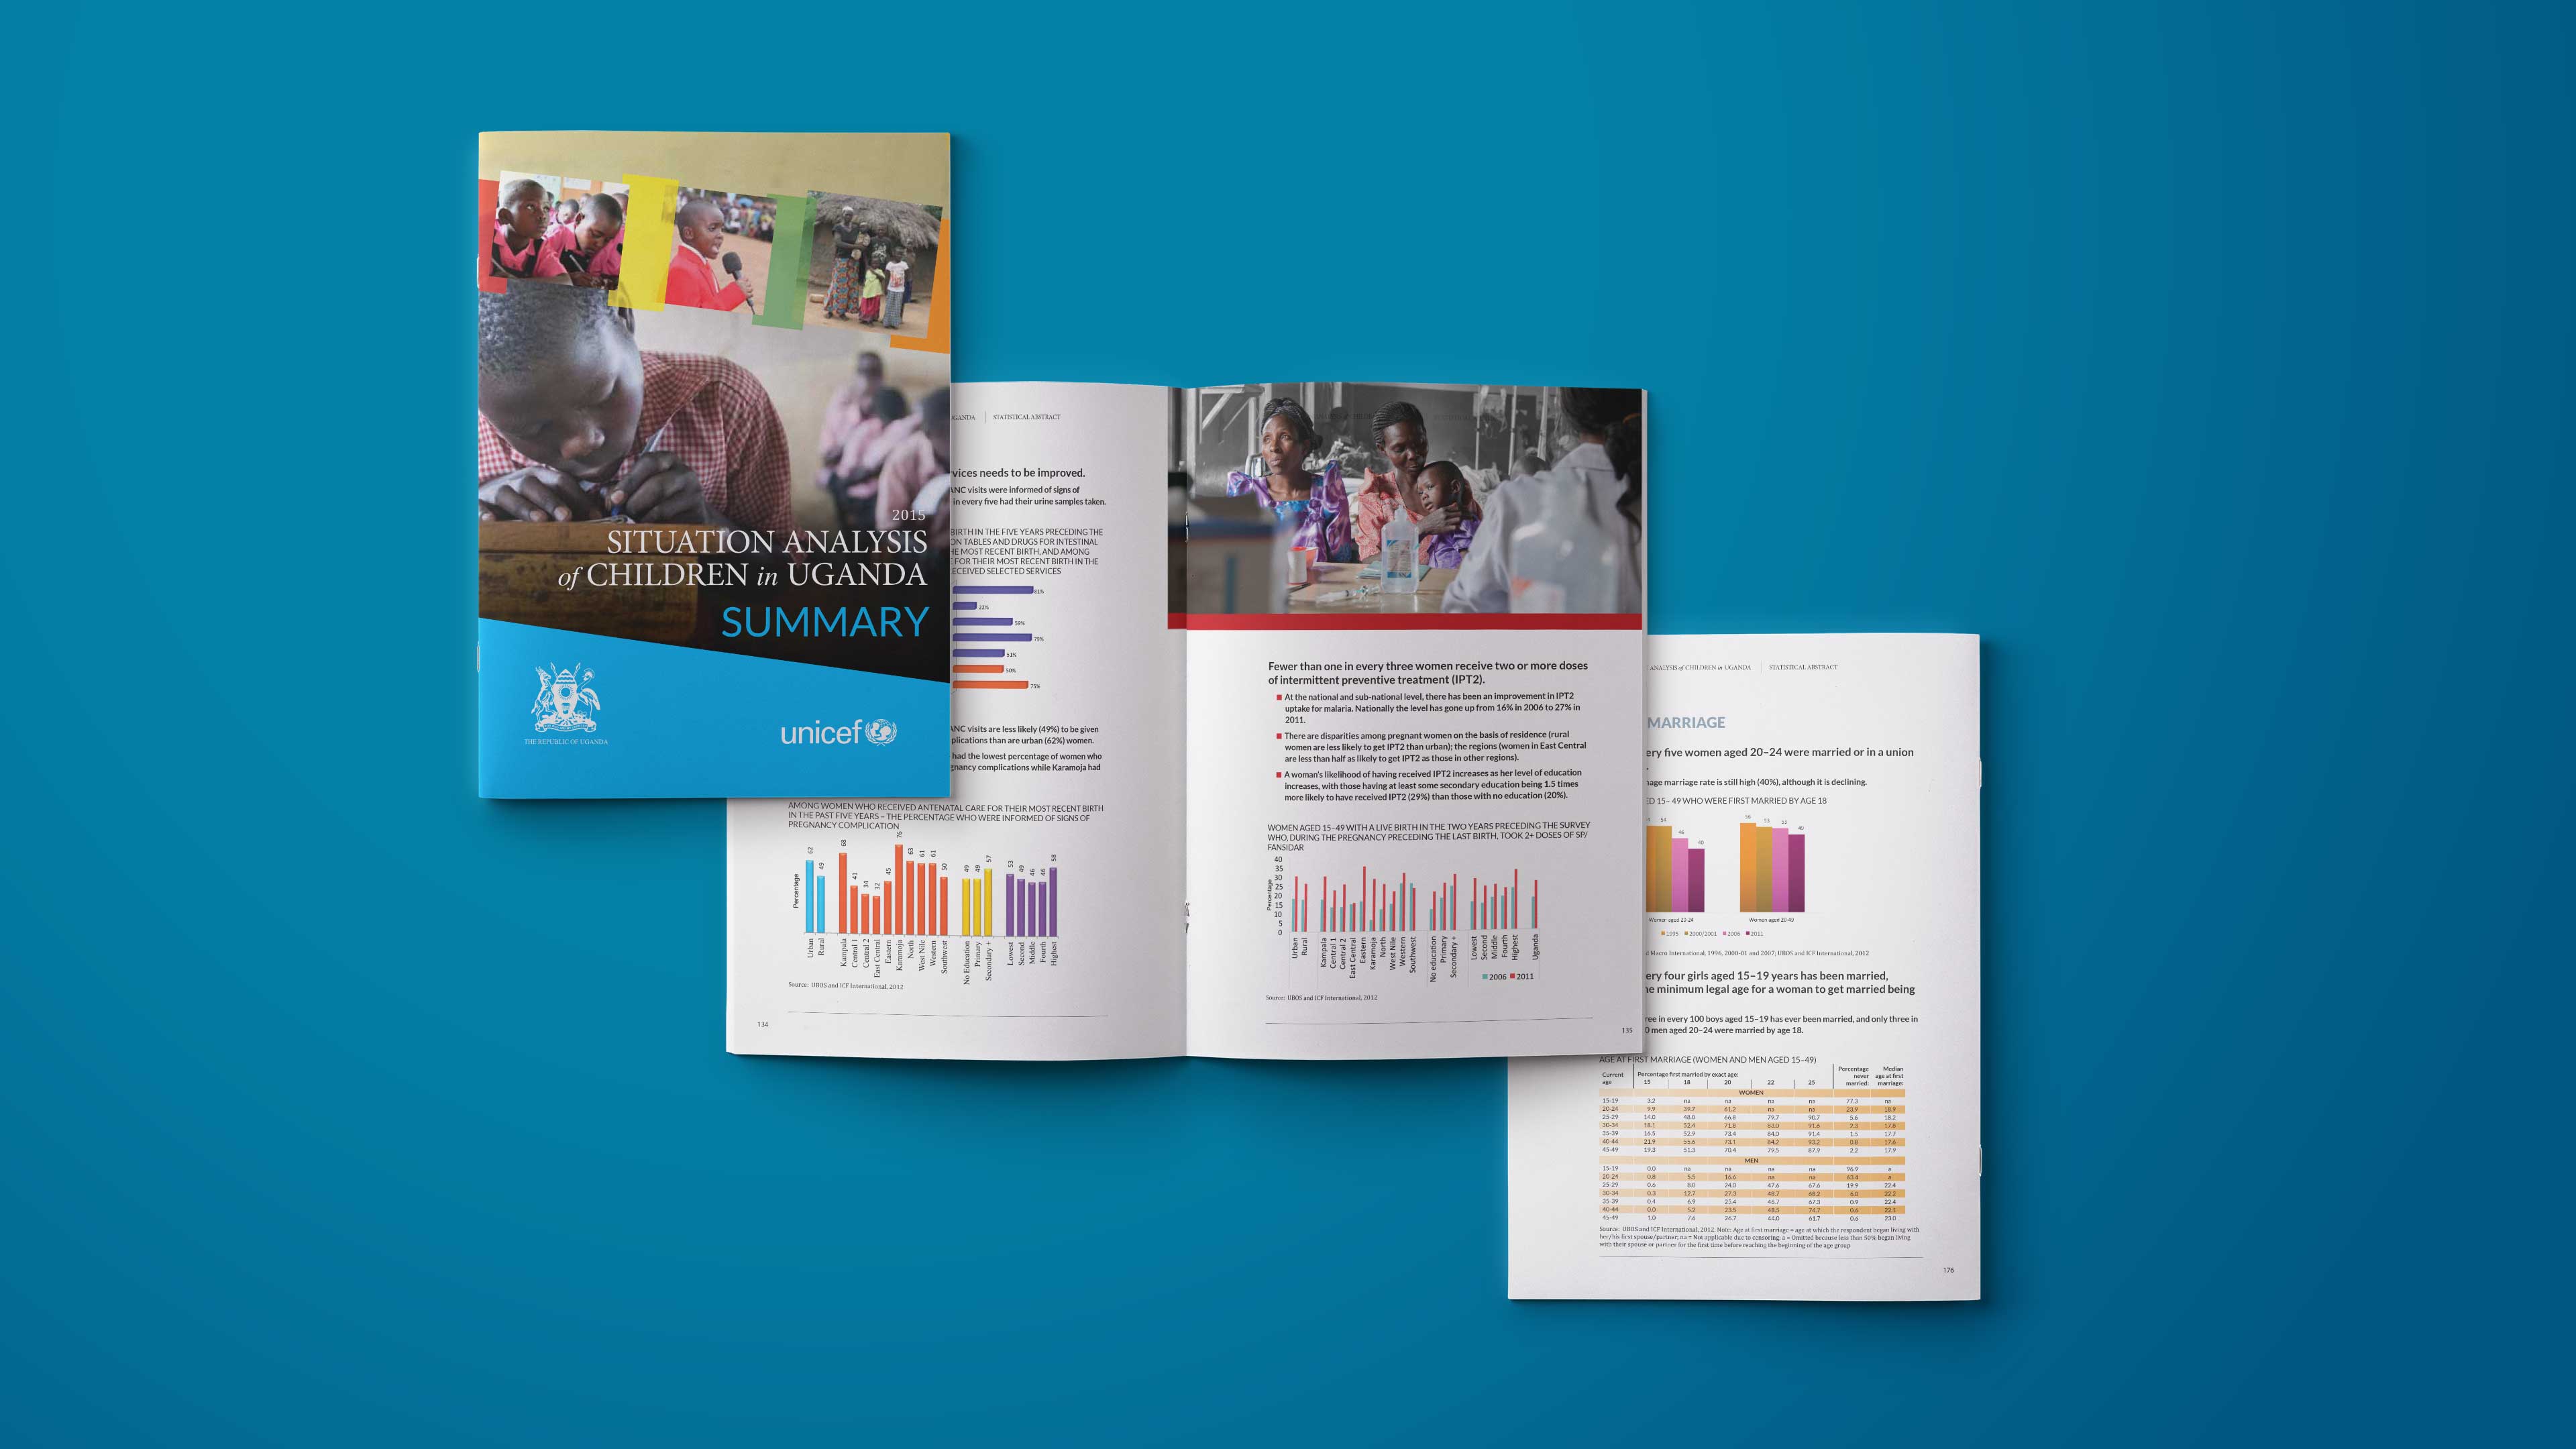
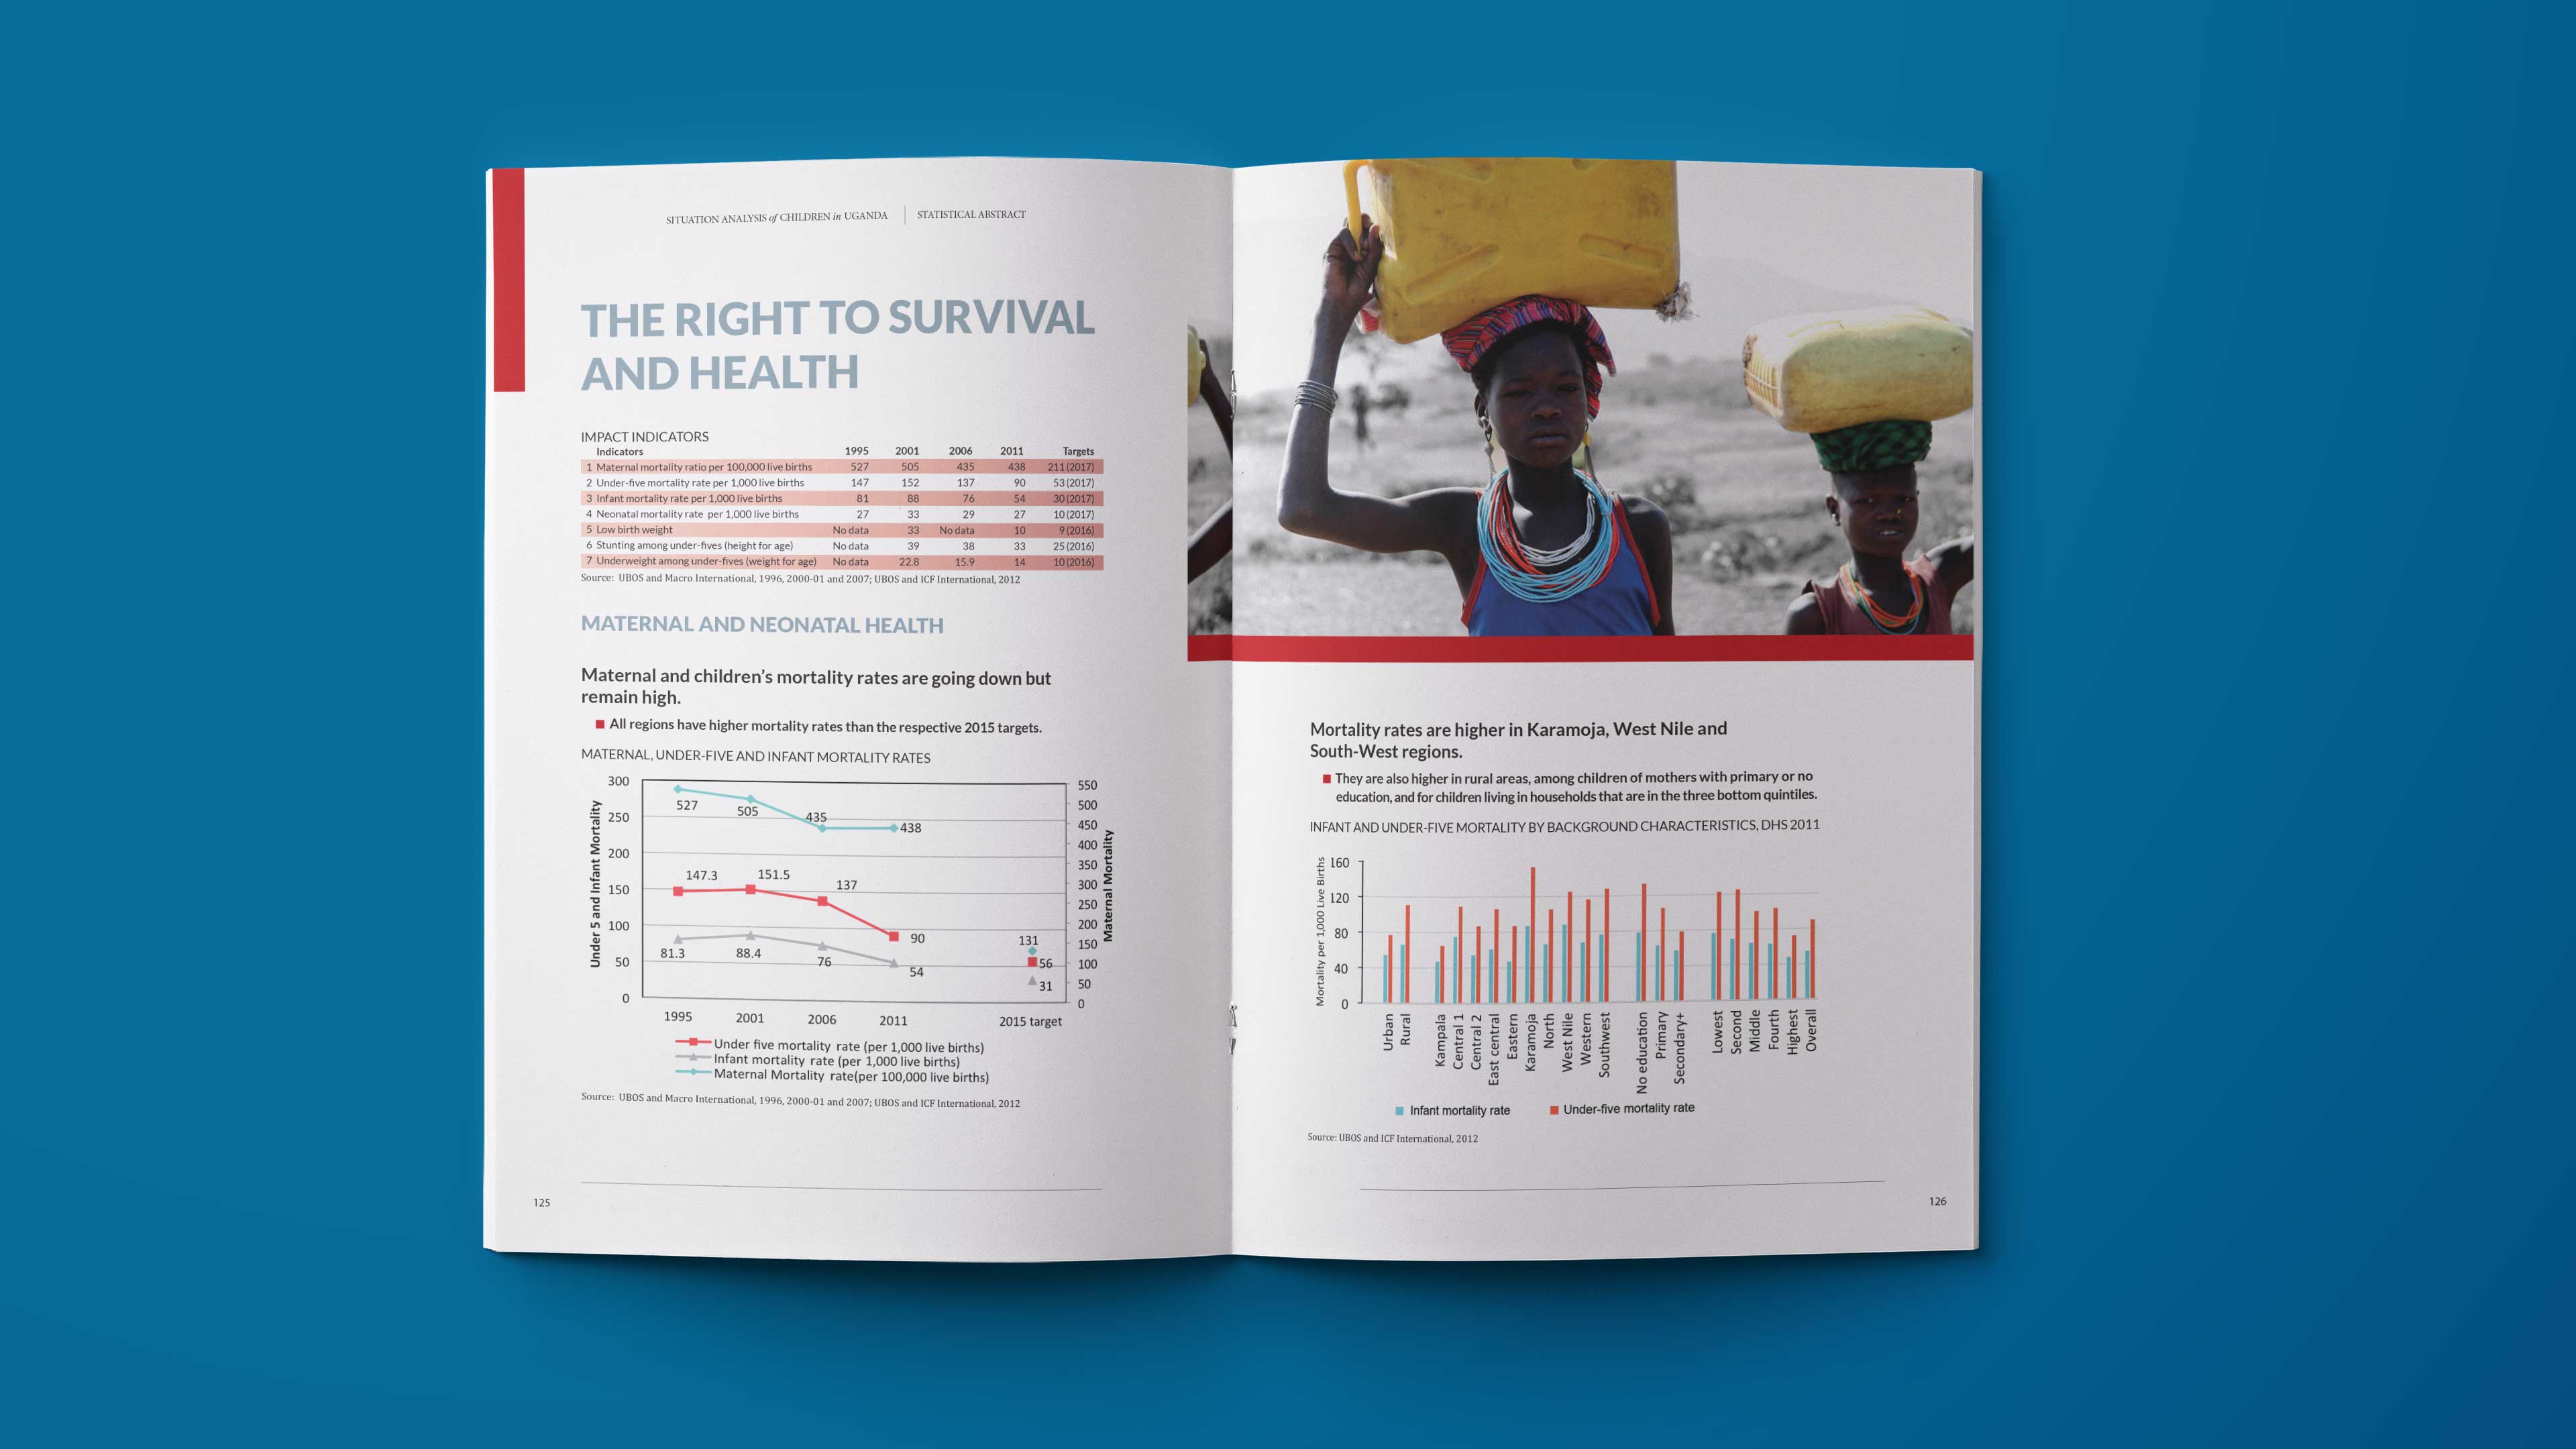
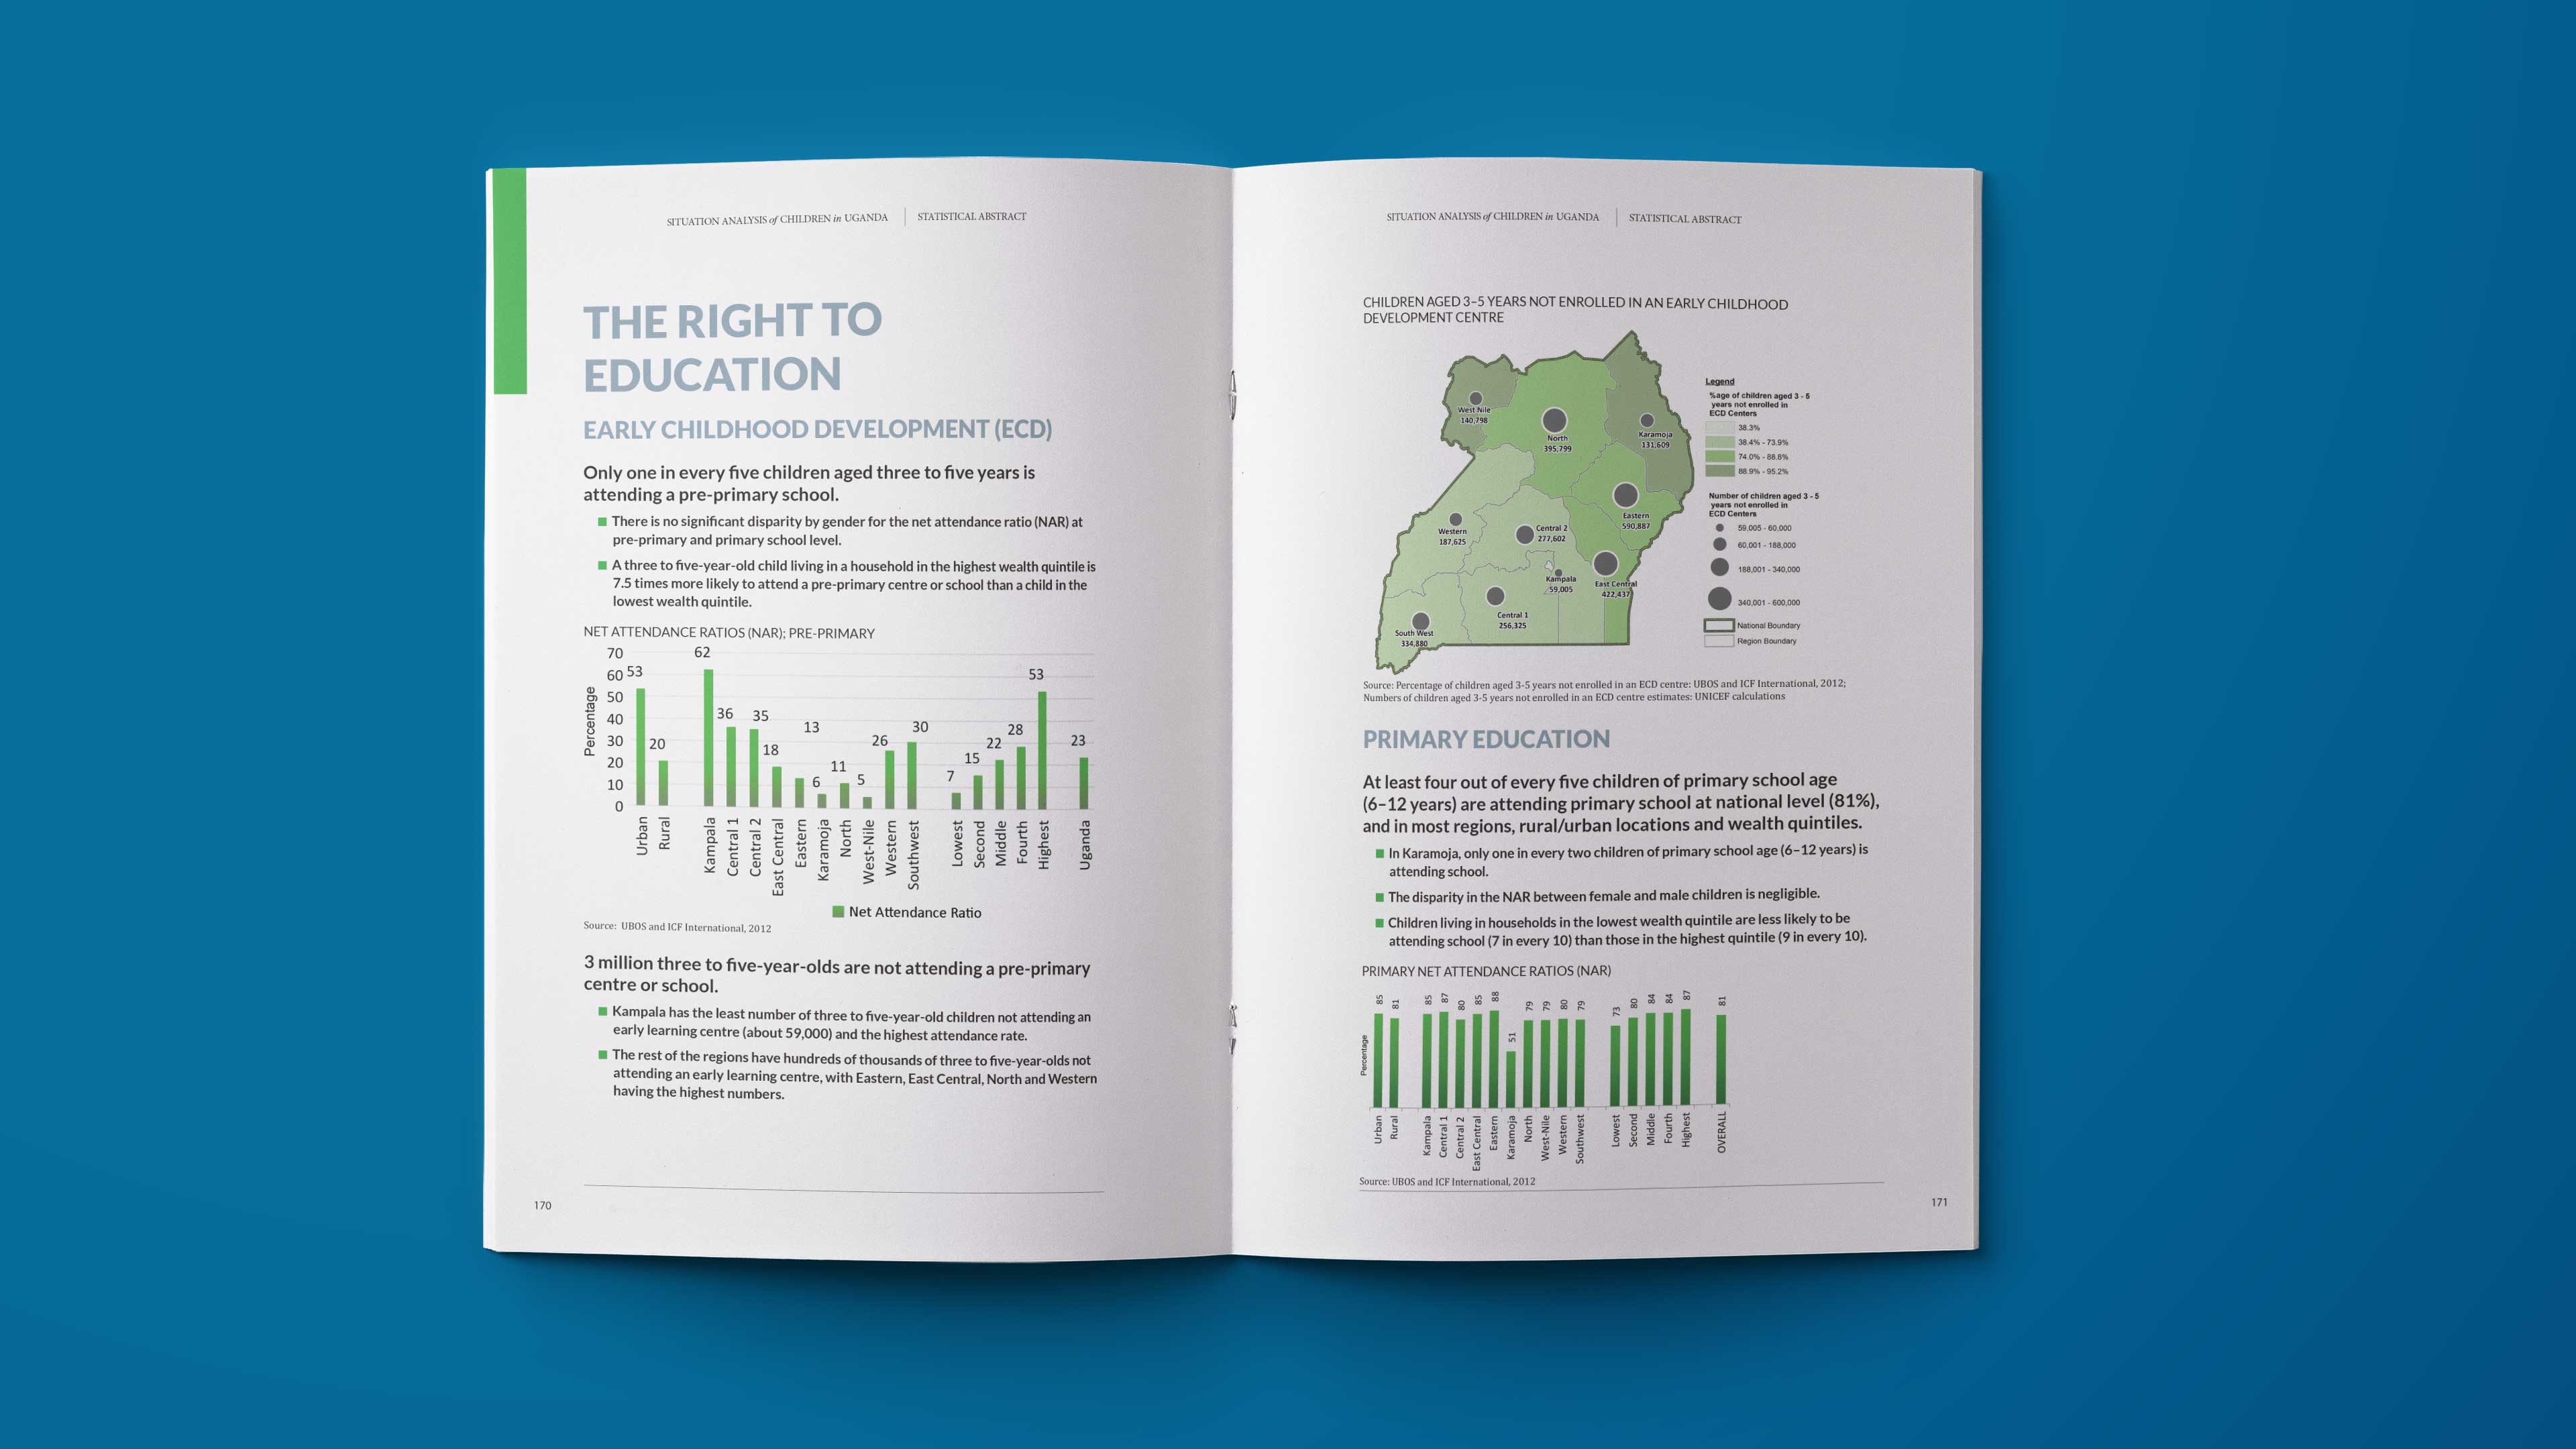
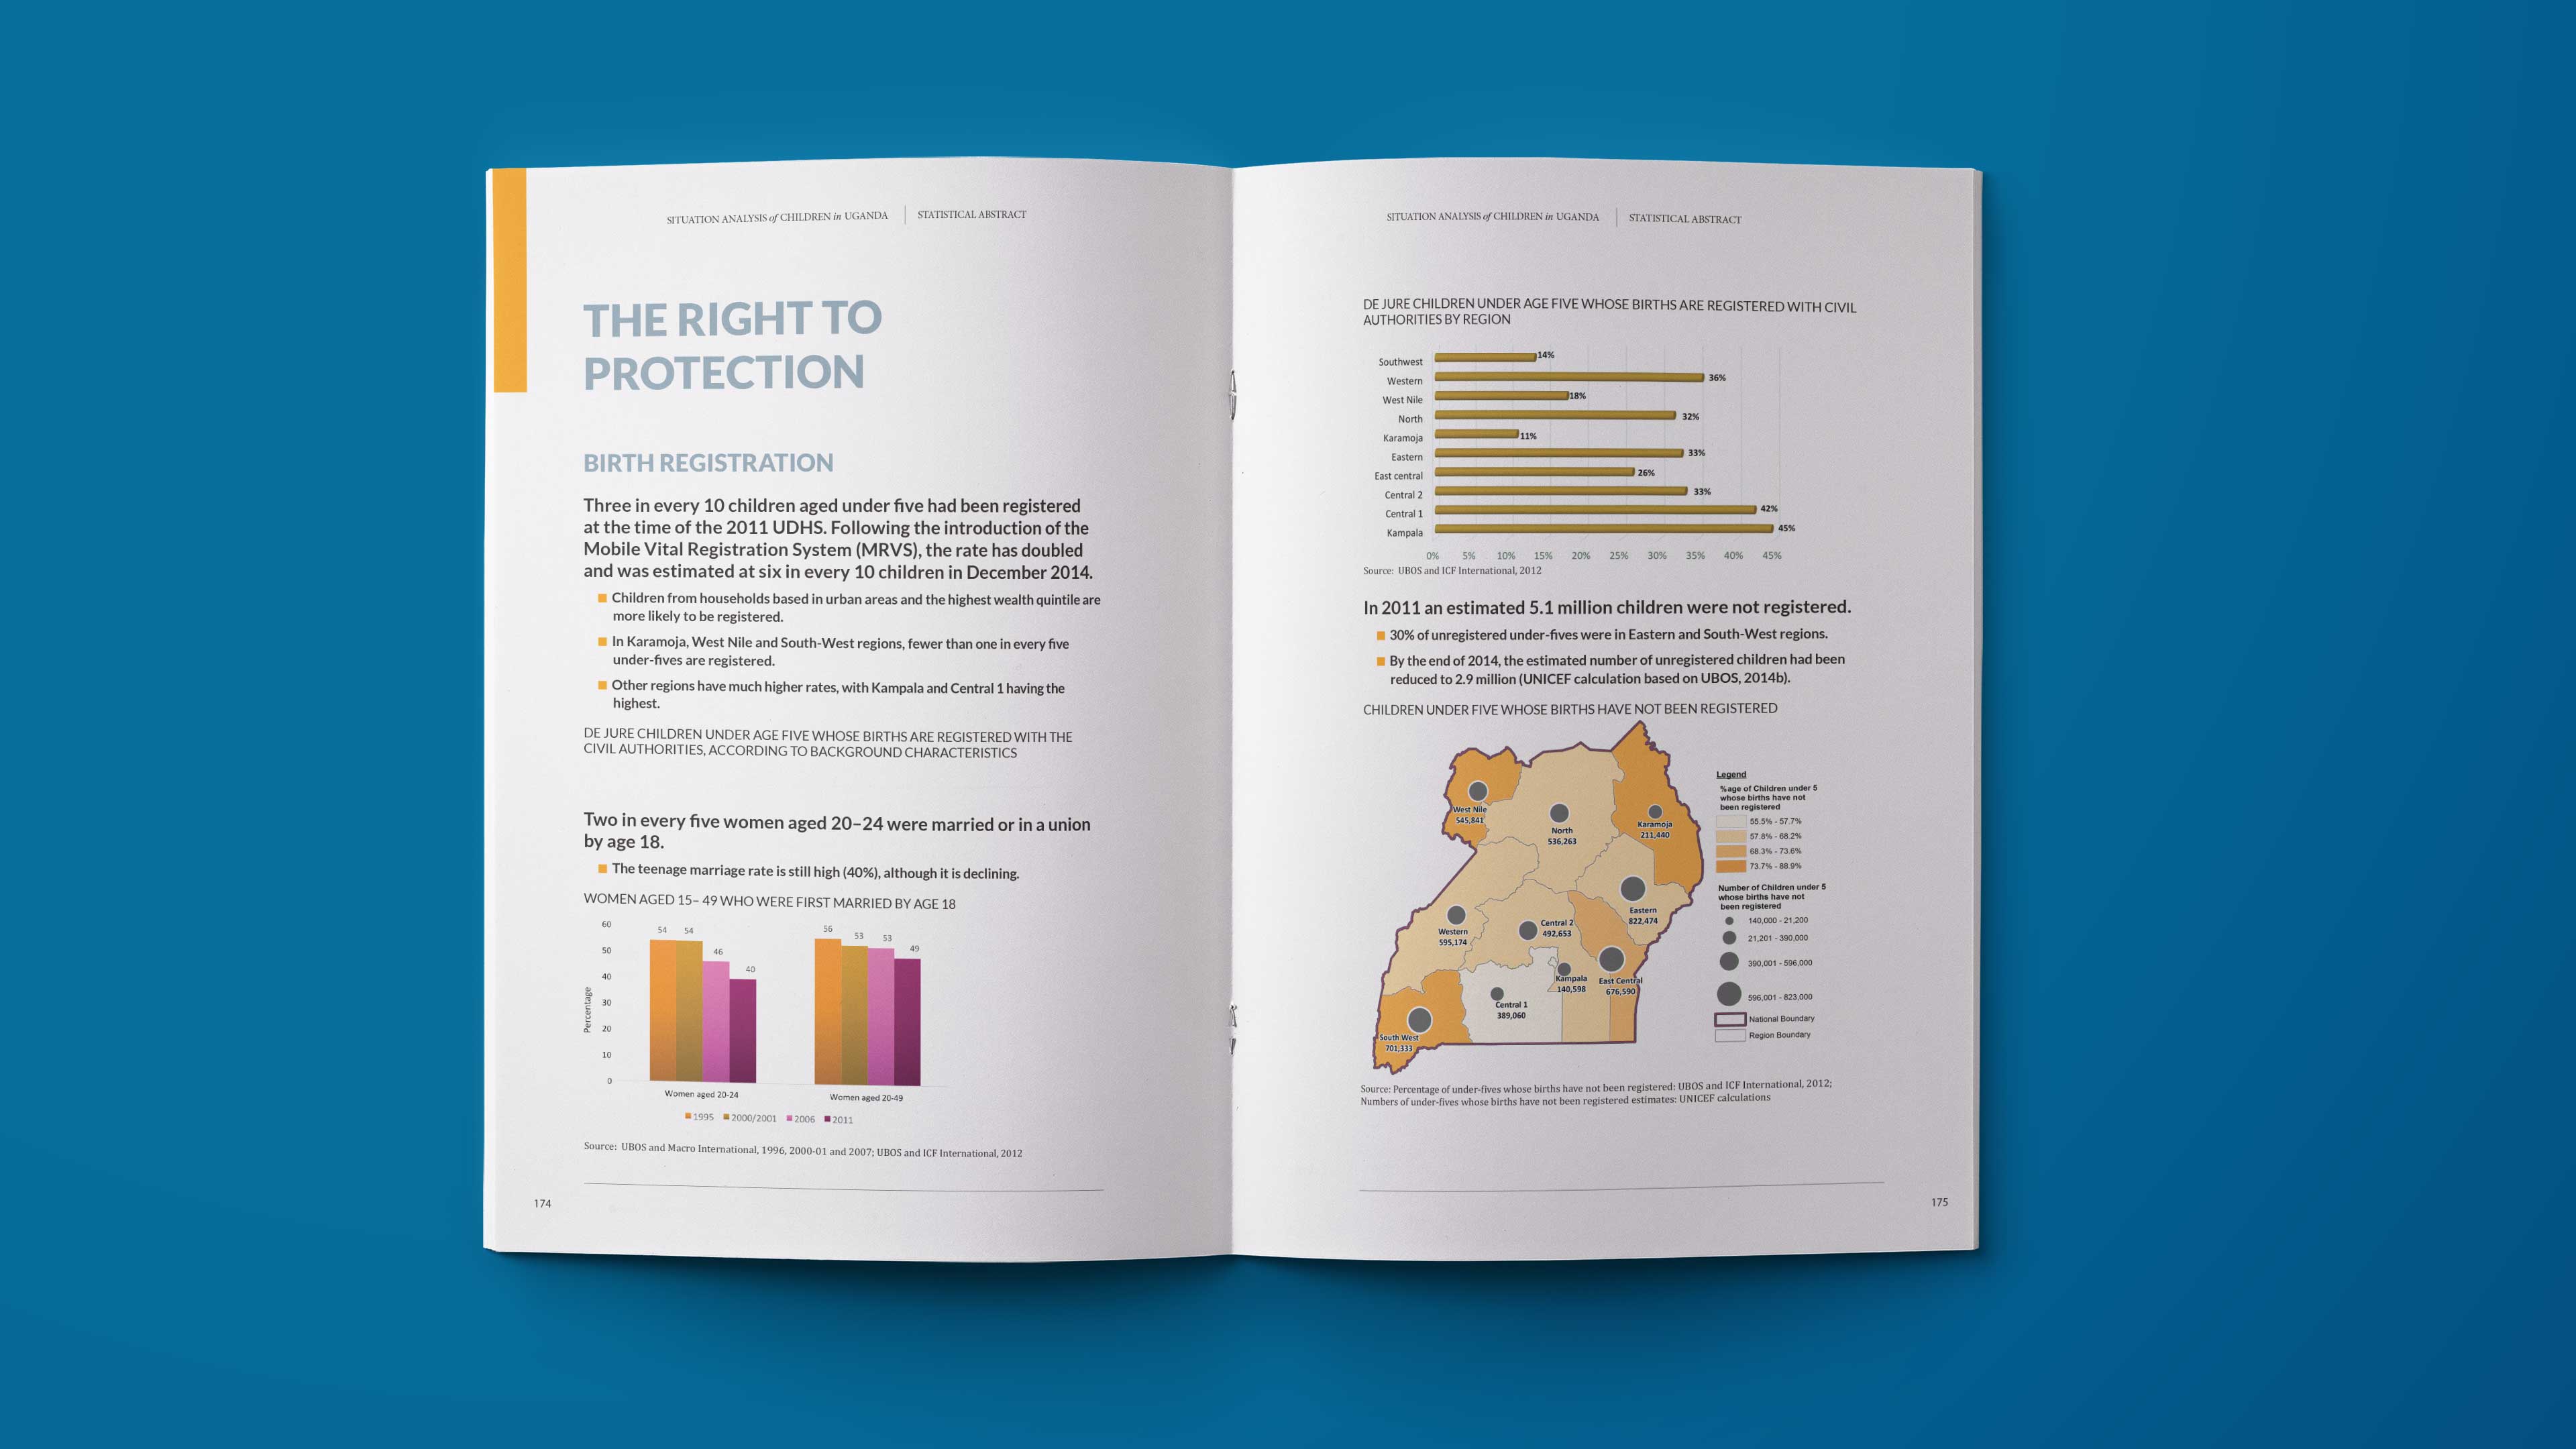
Using thematic colouring to divide the sections in the overall design made it easier for the reader to break down the information. I then interspersed photgraphs from the datatbase to lighten the heavy data content.
I took a research report supplied in a word document with a large amount of data, graphics and tables to design and laying out in a easy to handle report.
